Benchmarks
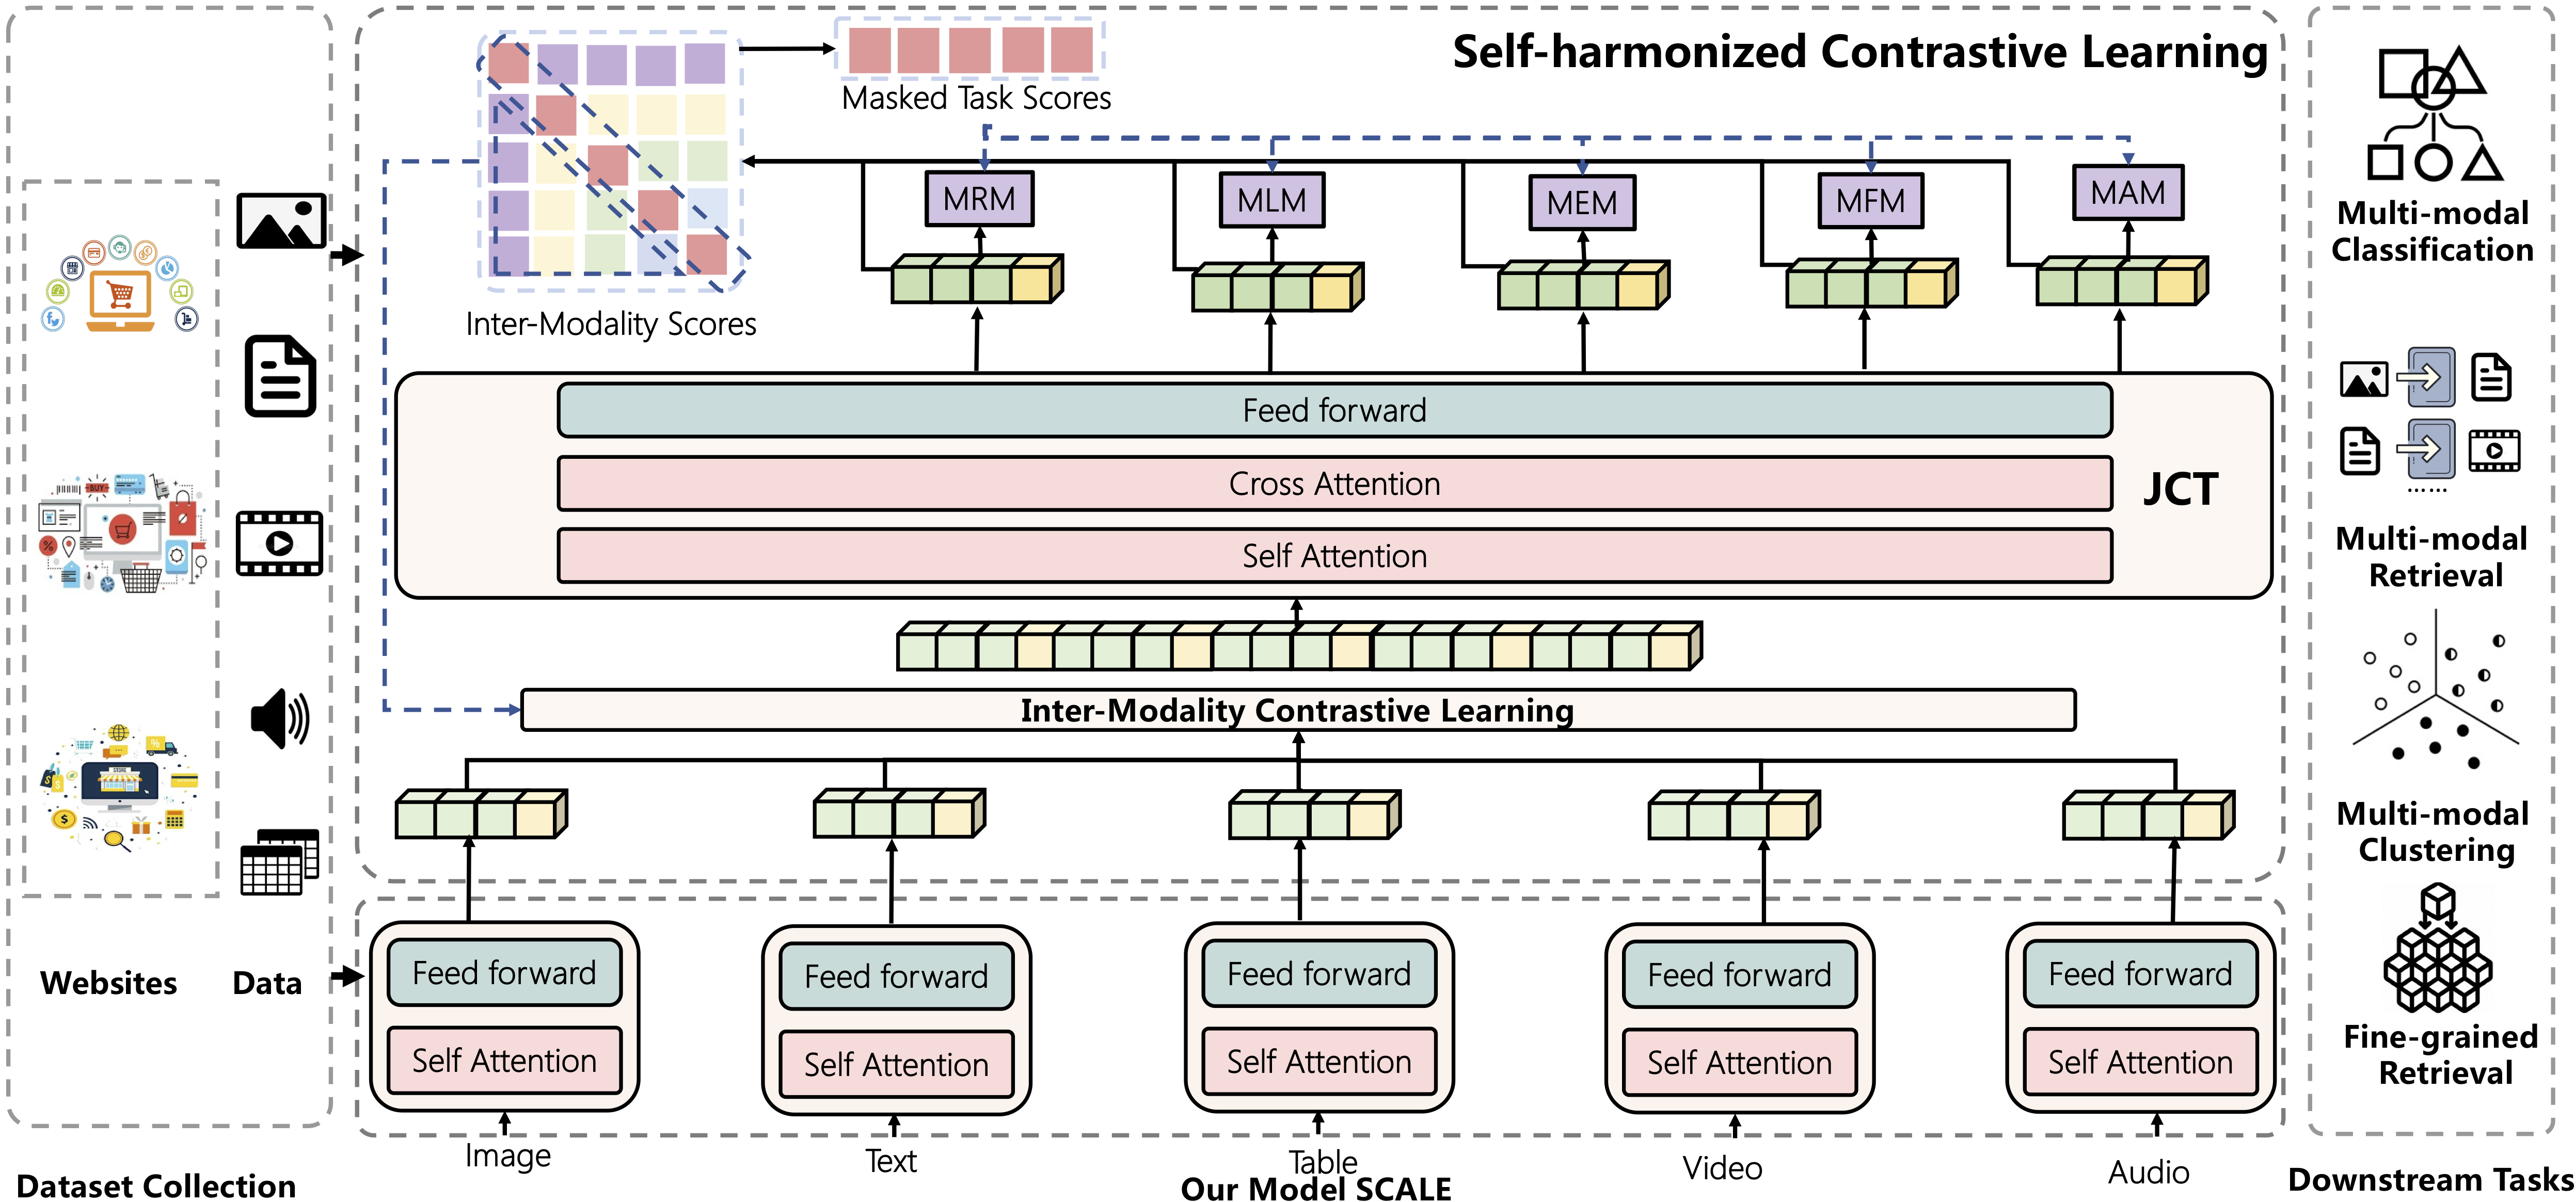
The overview of our model SCALE
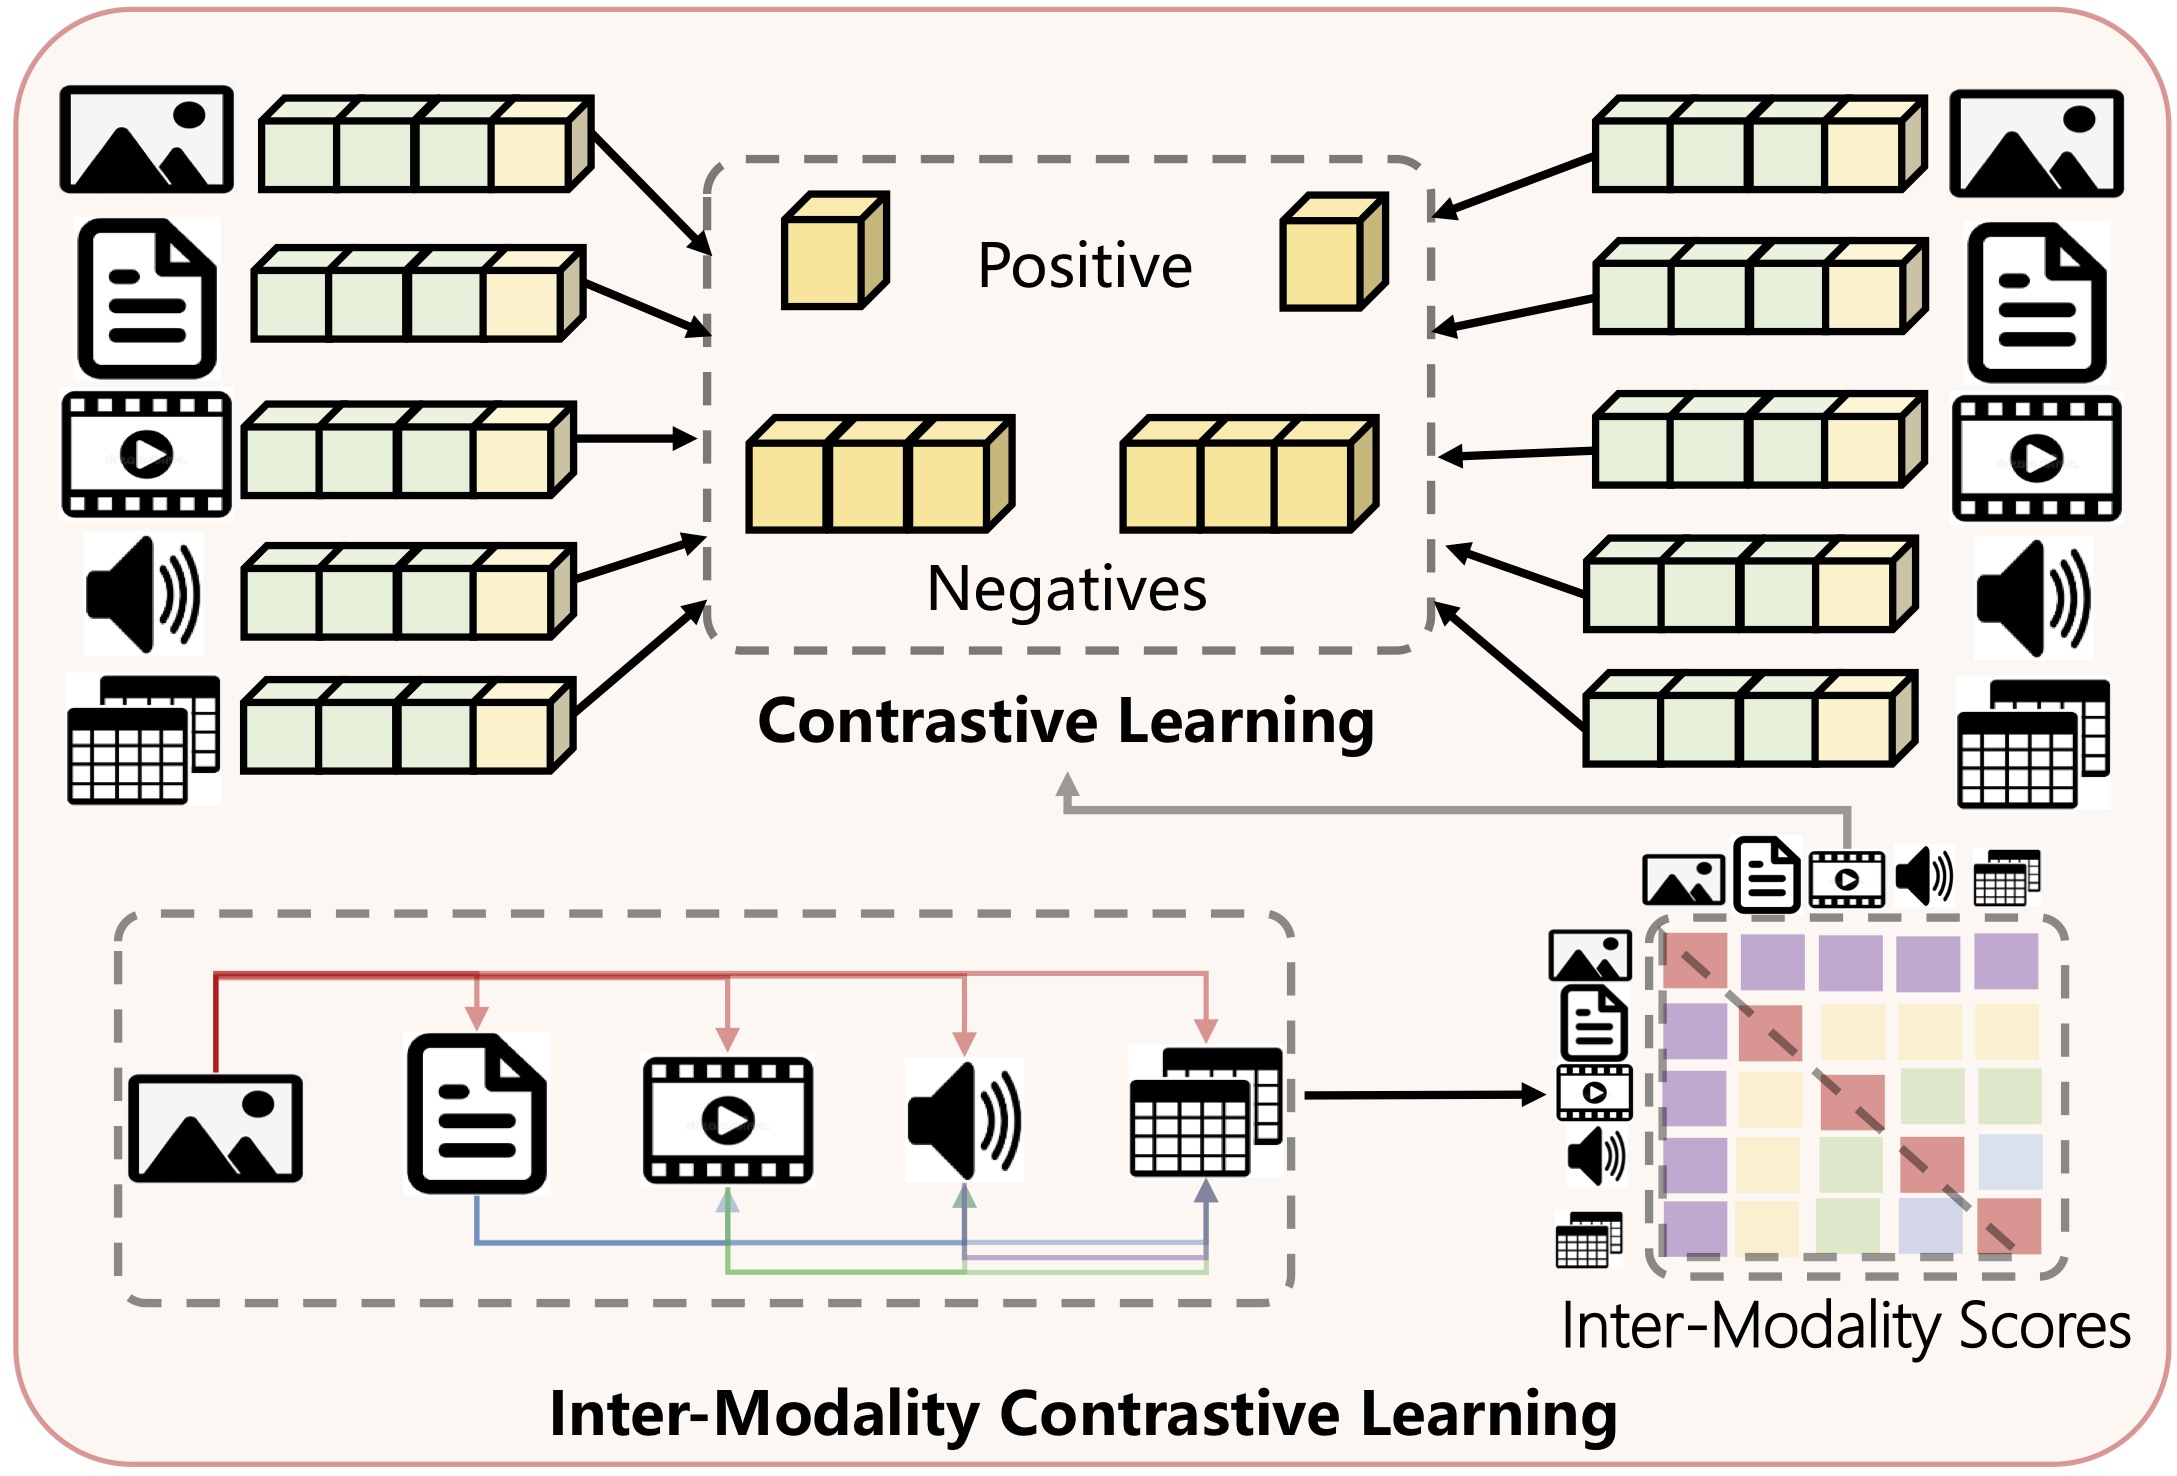
The detail of our proposed Inter-Modality Contrastive Learning module
The (pretrain/finetune) performance gains from sequentially adding more modalities using SCALE on the subset (top) and the whole dataset (bottom). The retrieval performances are based on the features extracted from pretrain and finetune stages.
| Model | Accuracy | mAP@1 | mAP@5 | mAP@10 | Prec@1 | Prec@5 | Prec@10 |
| Text | 77.42 | 47.70 / 65.10 | 53.63 / 68.39 | 51.59 / 66.99 | 47.70 / 65.10 | 30.96 / 44.89 | 24.15 / 33.44 |
| +Image | 79.58 | 51.47 / 67.02 | 56.16 / 69.85 | 54.41 / 68.43 | 51.47 / 67.02 | 33.41 / 46.29 | 25.55 / 34.29 |
| +Table | 82.83 | 57.14 / 67.97 | 61.71 / 70.34 | 59.64 / 69.38 | 57.14 / 67.97 | 38.02 / 46.85 | 28.99 / 34.36 |
| +Video | 84.31 | 58.57 / 69.79 | 63.15 / 72.30 | 61.02 / 70.67 | 58.57 / 69.79 | 39.26 / 47.44 | 29.56 / 34.78 |
| +Audio | 85.50 | 58.72 / 70.62 | 63.17 / 73.02 | 61.05 / 71.50 | 58.72 / 70.62 | 39.66 / 48.20 | 30.32 / 35.35 |
| Text | 81.11 | 55.82 / 69.47 | 60.74 / 72.74 | 59.02 / 71.79 | 55.82 / 69.47 | 36.99 / 48.76 | 28.04 / 35.84 |
| +Image | 83.68 | 59.81 / 71.51 | 64.13 / 74.51 | 62.18 / 73.21 | 59.81 / 71.51 | 38.97 / 49.27 | 30.15 / 36.72 |
| +Table | 84.63 | 61.32 / 72.34 | 65.53 / 74.86 | 63.62 / 73.47 | 61.32 / 72.34 | 40.66 / 49.77 | 30.78 / 36.95 |
| +Video | 84.90 | 62.65 / 72.59 | 65.67 / 75.05 | 63.87 / 73.62 | 62.65 / 72.59 | 41.18 / 49.96 | 31.01 / 37.04 |
| +Audio | 86.57 | 63.56 / 73.77 | 67.51 / 76.17 | 65.39 / 74.73 | 63.56 / 74.01 | 42.68 / 50.78 | 32.17 / 37.42 |
The performance of our model SCALE under different modality combinations on the coarse- and fine-grained multi-modal retrieval and classification tasks. In the following, I, T, Tab, V and A denote image, text, table, video and audio modalities, respectively.
| Modality Combinations | Accuracy | mAP@1 | mAP@5 | mAP@10 | Prec@1 | Prec@5 | Prec@10 |
| I+Tab | 62.00 | 44.53 / 45.97 | 49.62 / 51.89 | 48.28 / 50.33 | 44.53 / 45.97 | 30.89 / 34.08 | 23.65 / 28.63 |
| I+V | 34.57 | 20.57 / 36.29 | 26.78 / 42.72 | 26.41 / 41.38 | 20.57 / 36.29 | 14.71 / 26.52 | 11.78 / 22.34 |
| I+A | 27.67 | 15.73 / 35.64 | 20.85 / 42.96 | 20.72 / 41.70 | 15.73 / 35.64 | 11.16 / 27.02 | 9.47 / 22.78 |
| I+T | 79.58 | 67.02 / 62.20 | 69.85 / 66.97 | 68.43 / 64.21 | 67.02 / 62.20 | 46.29 / 49.85 | 34.29 / 42.36 |
| I+T+V | 80.34 | 67.35 / 63.05 | 70.29 / 67.37 | 68.95 / 64.62 | 67.35 / 63.05 | 46.45 / 50.85 | 34.33 / 43.02 |
| I+T+A | 79.73 | 67.19 / 64.21 | 70.15 / 68.25 | 68.64 / 65.35 | 67.19 / 64.21 | 46.33 / 50.42 | 33.32 / 42.93 |
| I+Tab+V | 63.09 | 45.94 / 47.33 | 51.32 / 53.33 | 49.78 / 51.28 | 45.94 / 47.33 | 31.69 / 35.81 | 24.12 / 30.05 |
| I+T+Tab | 82.83 | 67.97 / 68.30 | 70.34 / 72.67 | 69.38 / 70.07 | 67.97 / 68.30 | 46.85 / 57.44 | 34.36 / 50.59 |
| I+T+Tab+V | 84.31 | 69.79 / 68.40 | 72.30 / 72.91 | 70.67 / 70.31 | 69.79 / 68.40 | 47.44 / 57.60 | 34.78 / 51.47 |
| I+Tab+A+V | 63.54 | 47.24 / 48.24 | 52.07 / 53.89 | 50.41 / 51.89 | 47.24 / 48.24 | 32.19 / 36.29 | 24.47 / 30.74 |
| I+T+A+V | 80.36 | 68.80 / 66.43 | 70.84 / 71.12 | 69.71 / 68.16 | 68.80 / 66.43 | 47.24 / 54.03 | 34.57 / 47.53 |
| I+T+Tab+A | 84.33 | 70.23 / 68.97 | 72.59 / 73.07 | 70.94 / 70.77 | 70.23 / 68.97 | 47.58 / 57.89 | 35.33 / 51.60 |
| I+T+Tab+A+V | 85.50 | 70.62 / 69.25 | 73.02 / 74.08 | 71.50 / 71.02 | 70.62 / 69.25 | 48.20 / 58.76 | 35.35 / 52.05 |
Comparisons of image and text modalities on the subset (top) and the whole dataset (bottom).
| Method | mAP@1 | Accuracy | NMI | Purity |
| Imagebased | 15.17 | 27.67 | 63.62 | 54.86 |
| BERT | 47.70 | 77.42 | 76.35 | 68.80 |
| VL-BERT | 49.31 | 78.13 | 80.51 | 71.91 |
| ViLBERT | 49.18 | 78.24 | 80.51 | 71.91 |
| VisualBERT | 49.20 | 78.41 | 81.23 | 72.39 |
| CLIP | 49.39 | 78.35 | 81.75 | 72.50 |
| UNITER | 49.87 | 78.54 | 82.71 | 73.58 |
| CAPTURE | 50.30 | 78.69 | 83.06 | 74.14 |
| SCALE (Ours) | 51.47 | 79.58 | 84.23 | 75.81 |
| Imagebased | 22.67 | 30.14 | 67.49 | 59.64 |
| BERT | 55.82 | 82.11 | 87.30 | 71.75 |
| CLIP | 57.73 | 82.60 | 90.49 | 76.48 |
| SCALE (Ours) | 59.81 | 83.68 | 92.01 | 78.34 |